In this Post
Toolbar
The main Toolbar contains the most common actions which you usually perform (e.g. creating test resources or executing automation tests). Below is the main toolbar of Katalon Studio.

| Save the currently opened test artifact. | |
 |
Save all opened test artifacts. |
 |
Create a new test artifact. You can select an artifact type by clicking on the dropdown list:
|
 |
Open Object Spy dialog for capturing elements on websites. |
 |
Open Mobile Object Spy dialog for capturing elements on mobile applications. |
 |
Open Record dialog for recording WebUI test cases. |
 |
Open Mobile Recorder dialog for recording Mobile test cases. |
 |
Run the current open test case. You can select these options by selecting from dropdownlist:
|
 |
Debug the current open test case. You can select these options by selecting from dropdownlist:
|
| Stop the current execution | |
 |
Open Command Builder for generating commands for console execution |
 |
Command for Git activities. You can select these options by selecting from dropdownlist (after enabling Git):
|
Tests Explorer View
The Tests Explorer view allows you to browse the structure of your projects and access all test artifacts quickly. Using the context menu on the view, you can create new artifacts, organize the view’s items or drag and drop them to certain editor views if needed. Items in this view include:
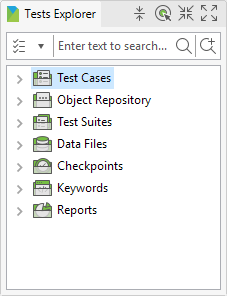
where:
| Group | Description |
| Test Cases | Contains all test cases within current project |
| Object Repository | Contains all test objects of the current project |
| Test Suites | Contains all test suites and test suite collections of the current project |
| Data Files | Contains all test data of the current project |
| Checkpoints | Contains all checkpoints of the current project |
| Keywords | Contains all custom keywords of the current project |
| Reports | Contains all generated reports of the current project |
Keywords Browser View
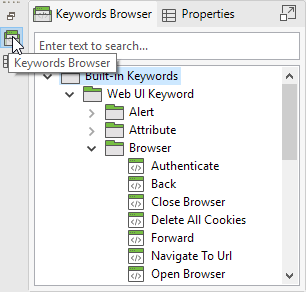
The Keywords Browser view displays all available keywords supported by Katalon Studio. You can drag and drop the keywords here to the Test Case editor when scripting.
Editors
The editor is used to modify detailed information of an object. Each test artifact has its own editor.
Test Case Editor
When you open a test case, its detailed information is shown in the editor that contains the following tabs:
- Manual tab
- Script tab
- Variables tab
- Integration tab
- Properties tab
Manual tab
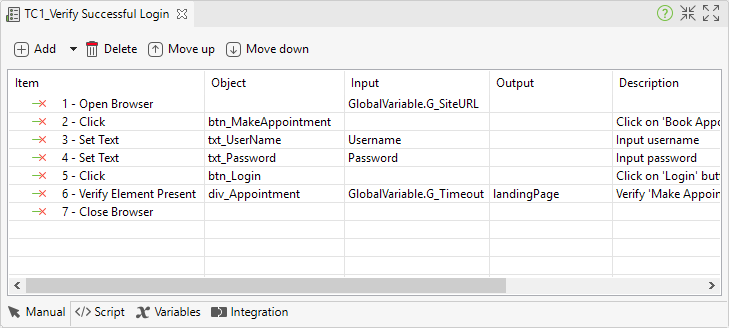
The Manual tab displays the Manual view where the basic keyword-driven-configuration allows novice users to create automation tests effortlessly. Refer to Test Case Manual View for more details.
Script tab
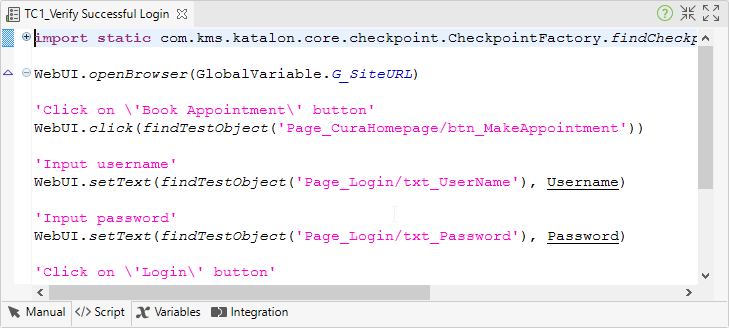
This tab displays the Script view where advanced users with programming background can modify test scripts easily using either Groovy or Java. Refer to Test Case Script View for more details.
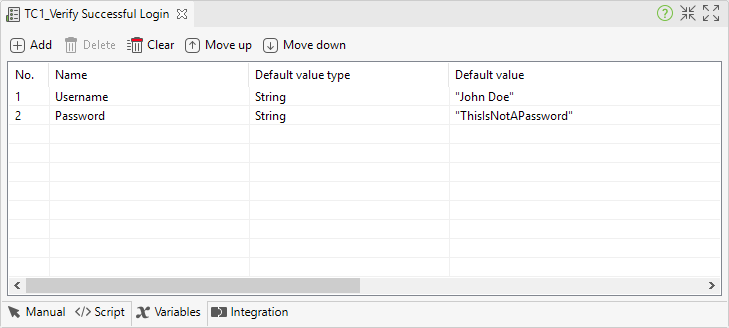
Variables tab
The Variables tab shows all variables defined for the test case. Refer to Public Variables for more details.
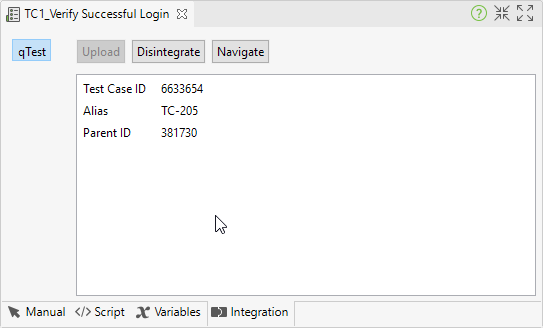
Integration tab
Information regarding your test case integration with qTest is displayed in this tab. Refer to Integrate test case for more details.
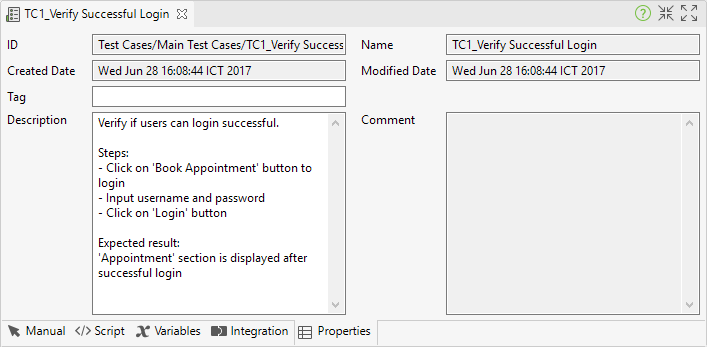
Properties tab
General information about the test case is displayed in this tab.
Test Object Editor
When you open a test object, its detailed information including properties and object identification mechanism is displayed in the Test Object editor. Refer to Spy Object for more details.

Web Service Editor
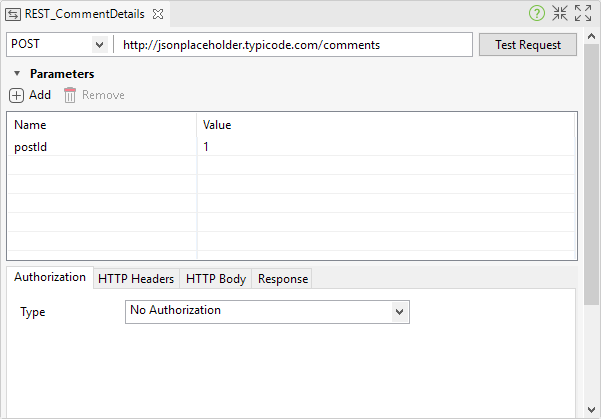
RESTful Request Object Editor
When you open a RESTful request object, its detailed information such as the resource URL, request methods, and parameters is displayed in this editor. Refer to Web Services for more details.
SOAP Request Object Editor
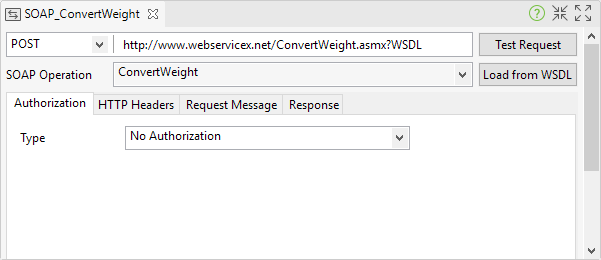
When you open a SOAP request object, its detailed information such as the resource URL, request methods, and parameters is displayed in this editor. Refer to Web Services for more details.
Test Suite Editor
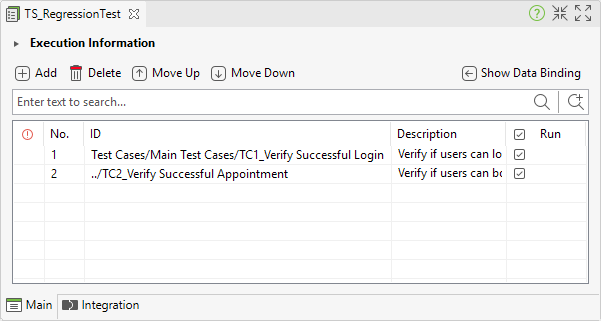
When you open a test suite, its detailed information is displayed in the Test Suite editor that contains the following tabs:
- Main tab
- Integration tab
Main tab
The main tab displays basic information about the test suite such as the test cases to be executed, the execution mechanism and data binding. Refer to Execute a test suite for more details.
Integration tab
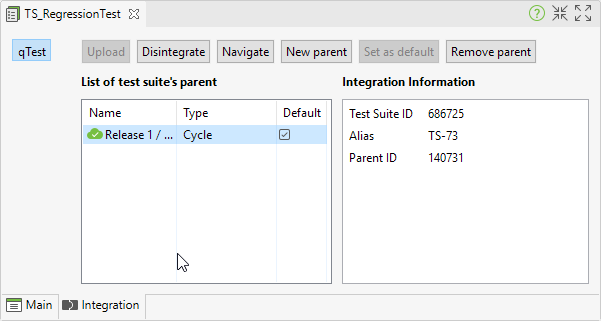
Information regarding your test suite integration with qTest is displayed in this tab. Refer to Integrate test suite for more details.
Test Suite Collection Editor
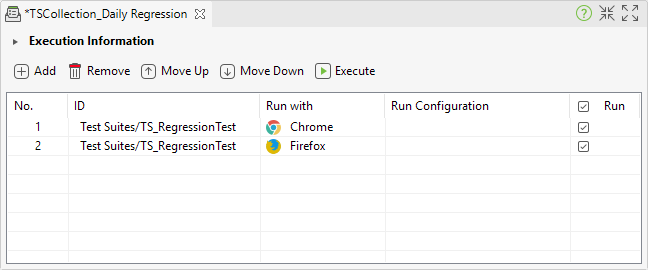
Basically, a Test Suite Collection contains a set of test suites to allow users to execute test suites together. Refer to Execute a test suite collection for more details.
Data File Editor
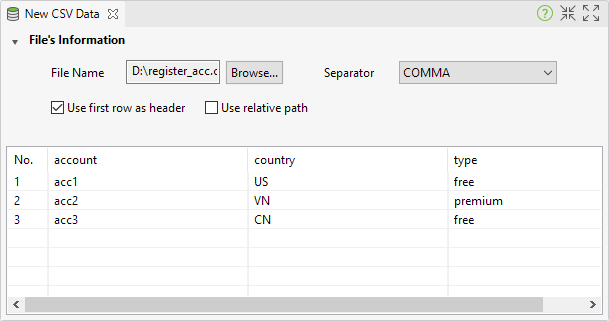
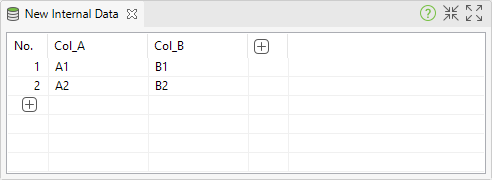
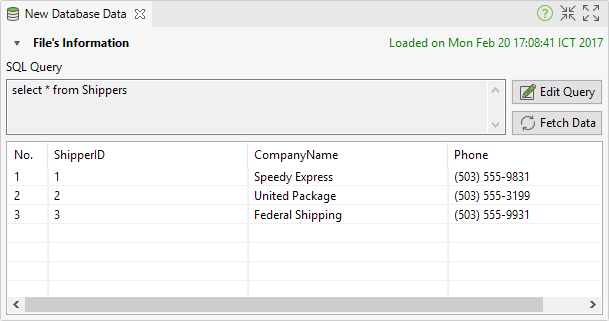
When you open a data file, its detailed information including the data source and preview data set is displayed in the editor. Refer to Manage Test Data for more details.
- If the test data is from an Excel file:

- If the test data is from a CSV file:
- If the test data is defined internally inside your test project:
- If the test data is from a database query:
Checkpoint Editor
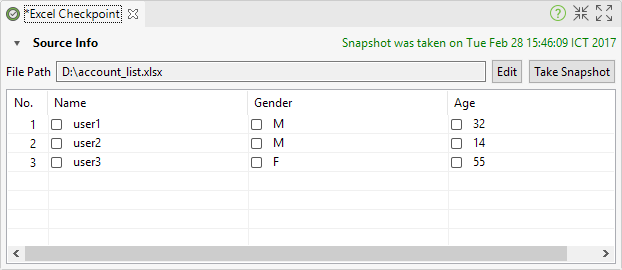
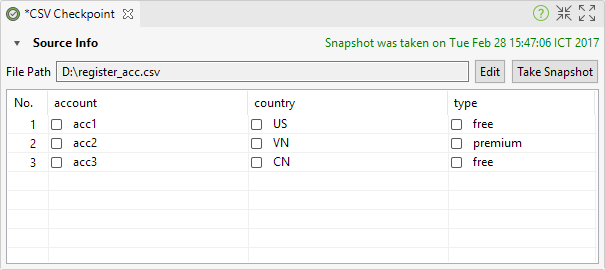
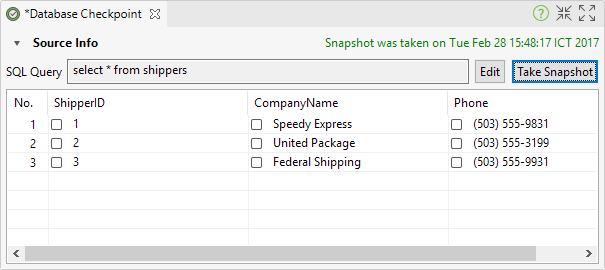
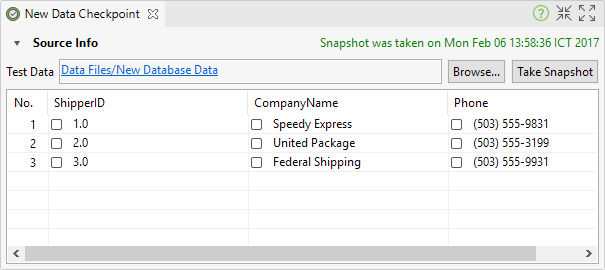
When you open a checkpoint, its detailed information including the data source and its taken snapshot… is displayed in the editor. Refer to Manage Checkpoint for more details.
- If the data source is from an Excel file:
- If the data source is from a CSV file:
- If the data source is from a database:
- If the data source is from existing test data:
Keyword Editor
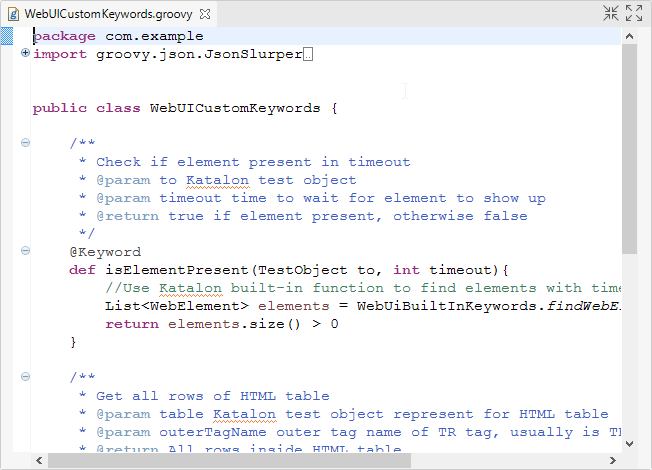
When you open a custom keyword, its content is displayed in the scripting editor. This scripting editor is similar to the Script view of test cases where you can define new custom keywords easily using Groovy or Java. Refer to Define custom keywords for more details.
Global Variables View
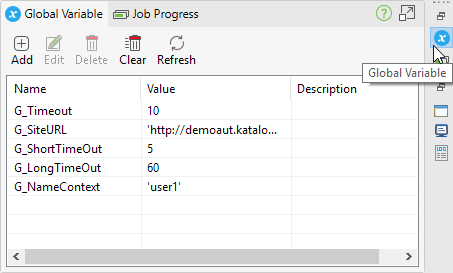
The Global Variables view allows you to browse the list of available global variables defined in your project. Refer to Global Variables for more details.
Job Progress View
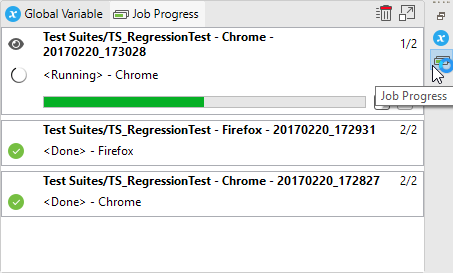
The Job Progress view allows you to see the progress of executing test cases and test suites.
Problems View
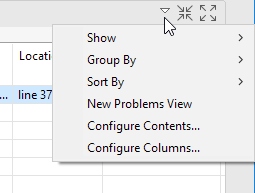
The Problems view shows errors and warning messages raised when you are setting up a project or designing the test case, test suite, test object or test data.

The messages displayed in the Problems view can be configured via the drop-down menu of this view.
Console View
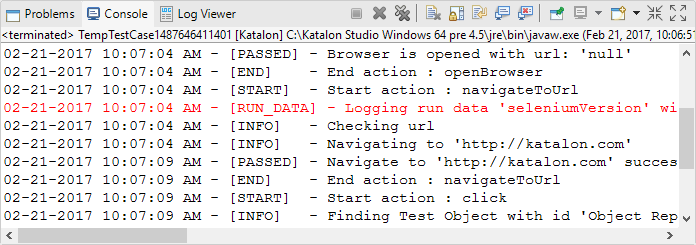
The Console view shows the system logs of all run-time activities performed while the automation test is being executed. The console output generated from test scripts is also displayed here.
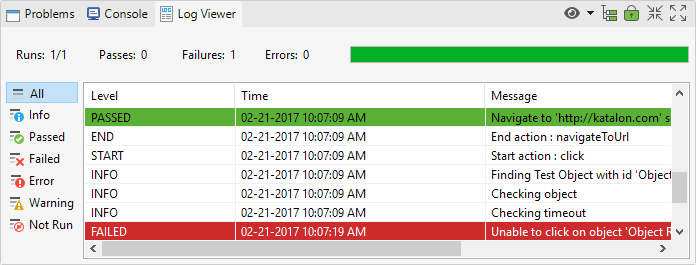
Log Viewer View
The Log Viewer view shows the real-time report/log of the test execution. Refer to View Execution Log for more details.
Search View
The Search view shows the search results from the search function. You can double-click on a search entry to navigate to the corresponding position in the editor.

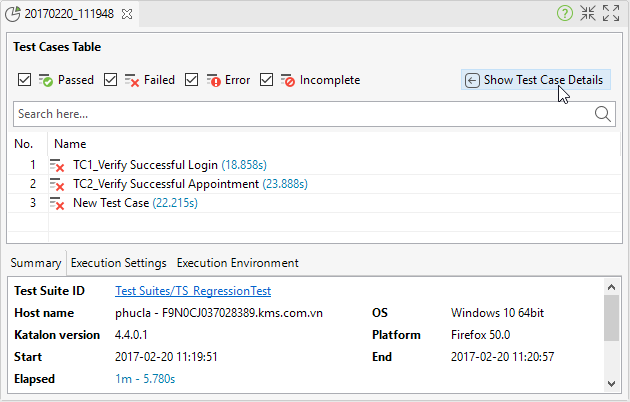
Report View
The Report view allows you to view detailed information of a completed test execution for a certain test suite. Refer to Test Suite Report for more details.
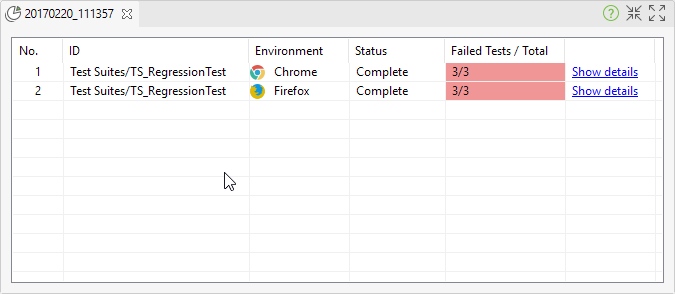
Test Suite Collection Report view
This view allows you to view detailed information of a completed test execution for a certain test suite collection. Refer to Test Suite Collection Report for more details.


[…] Katalon Studio GUI Overview – Saket Kumar – https://automated-360.com/katalon-studio/katalon-studio-gui-overview/ […]
[…] This tutorial explains how to setup a mobile automation project and test a mobile app using Katalon Studio on Windows. This tutorial assumes that you are familiar with general principles of automated testing and have some experience with Katalon Studio IDE. […]
[…] This tutorial explains how to setup a mobile automation project for Katalon Studio in macOS. It assumes that you are familiar with general principles of automated testing and have minimal knowledge of the Katalon Studio IDE. […]